はじめに
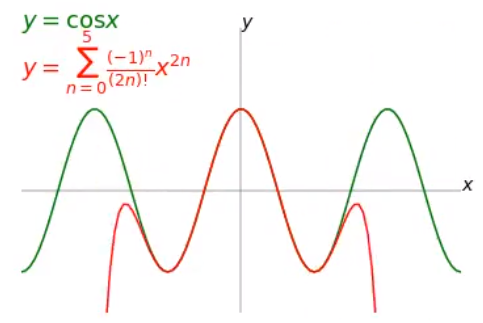
マクローリン展開をアニメーションで見せる動画をPythonで作る方法を紹介します。
開発環境は Google Colab です。
マクローリン展開アニメーションです。 pic.twitter.com/wEeE8CP5PD
— 機械学習基礎理論独習 (@PG12345678) 2021年10月24日
Google Colabってなに?
Google ColabとはGoogle Chromeで動く開発環境のことで、Google Chromeで動くアプリケーションのことです。
なので、OS関係なく動かすことができると思います。
インストール方法は、忘れましたが、簡単なはずです。
すみませんが、ググってください。
アニメーションの作成方法
Line2DやTextのインスタンスの配列を要素とする配列(フレーム)を作成します。
以下はフレームを作成する一部のコードです。
# x軸を描画
im_x, = ax.plot(xlim, [0,0], color='gray', alpha=0.5)
text_x = ax.text(xlim[1], 0, r"$x$", size=14)
# y軸を描画
im_y, = ax.plot([0,0], ylim, color='gray', alpha=0.5)
text_y = ax.text(0, ylim[1], r"$y$", size=14)
# 近似される曲線を描画
im_base, = ax.plot(x,y, color="green")
text_base = ax.text(xlim[0], ylim[1], r"$y={\rm e}^x$", color="green", size=18)

# アニメーション開始前のフレームを描画
for i in range(start_frames):
    artists.append([im_x, text_x, im_y, text_y, im_base, text_base])
あとは、アニメーションを作成して、動画ファイルとして保存すれば、OKです。
# ArtistAnimationにfigオブジェクトとimsを代入してアニメーションを作成
anim = animation.ArtistAnimation(fig, artists, interval=fps)

# Google Colaboratoryの場合必要
rc('animation', html='jshtml')
plt.close()

# 保存
anim.save('/content/drive/MyDrive/Python/アニメーション/テイラー展開y=e^x.mp4')
どうやって滑らかに見せているのか
現在の点と前の点の差分を取って、前の点から現在の点に徐々に近づくようにアニメーションのフレームを作成しています。
該当ソースは、以下です。(抜粋しています)
y2_diff = y2 - y2_old

for j in range(animation_frames):

        # 近似曲線を描画
        rate = (j + 1) / animation_frames
        im_approx, = ax.plot(x,y2_old + y2_diff * rate, color="red")
多分この説明では分かりにくいと思うので、例を上げます。
ある点A から 点B
まで点が滑らかに動いているように見せるためには、
方向ベクトル を少しずつ
に加えてあげるとよいです。
点Aから少し(2/5程)動いた点C は
と表現できます。
同様に、点Aからかなり(4/5程)動いた点C は
と表現できます。
動かすときの注意
動画を作成するので、実行完了までに10秒ほどかかります。
ソースの最後にあるファイルのパスは変更してください。
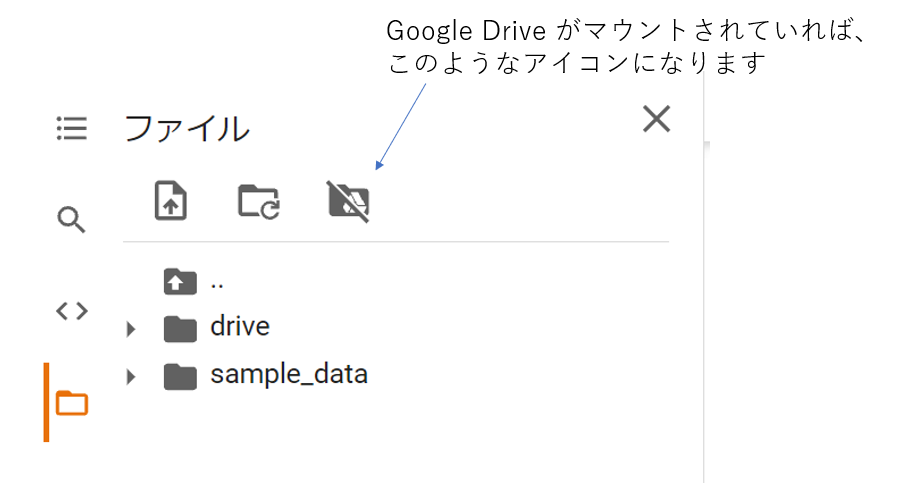
Google Driveに保存する場合は、Google Drive をマウントする必要があります。
ソース
全ソースです。Pythonは未熟であるので、よいソースではないかもしれません。
import matplotlib.pyplot as plt
import numpy as np
import math
from matplotlib import animation, rc
from IPython.display import HTML

def taylor(x, N):
    y = np.zeros(len(x))
    for n in range(N):
        y += 1 / math.factorial(n) * x ** n
    return y

def text_taylor(N, max = 6):
    y = ""
    if N >= max:
        if N >= 100:
            y = r"$y=\sum_{n=0}^{\infty} \frac{1}{n!}x^{\infty}$"
        else:
            y = r"$y=\sum_{n=0}^{" + "{}".format(N - 1) + r"}\frac{1}{n!}x^{n}$"
    else:
        for n in range(N):
            if n == 0:
                tmp_y = r"$y=1$"
            elif n == 1:
                tmp_y = r"$+x$"
            else:
                tmp_y = r"+$\frac{1}{" + "{}".format(n) + "!}x^{" + "{}".format(n) + "}$"
            y += tmp_y
    return y

# オープニングのフレーム数
opening_frames = 60

# アニメーションが始まるまでのフレーム数
start_frames = 15

# アニメーションフレーム
animation_frames = 30

# アニメーション間のフレーム
interval_frames = 15

# 1秒当たりのフレーム数
fps = 1000/ 60

max_iter = 12

xlim = np.array([-6, 6])
ylim = np.array([-5, 20])

# fig, axオブジェクトを作成
fig, ax = plt.subplots()

# グラフのリスト作成
artists = []

x = np.linspace(xlim[0], xlim[1], 100)
y = np.exp(x)

y2_old = np.zeros(len(x))

# オープニングのフレーム数を描画
text = ax.text(np.mean(xlim), np.mean(ylim), r"$y={\rm e}^x=\sum_{n=0}^{\infty} \frac{1}{n!}x^{\infty}\ (-\infty < x < \infty)$", verticalalignment="center", horizontalalignment="center", size=20)
for _ in range(opening_frames):
    artists.append([text])

# x軸を描画
im_x, = ax.plot(xlim, [0,0], color='gray', alpha=0.5)
text_x = ax.text(xlim[1], 0, r"$x$", size=14)
# y軸を描画
im_y, = ax.plot([0,0], ylim, color='gray', alpha=0.5)
text_y = ax.text(0, ylim[1], r"$y$", size=14)
# 近似される曲線を描画
im_base, = ax.plot(x,y, color="green")
text_base = ax.text(xlim[0], ylim[1], r"$y={\rm e}^x$", color="green", size=18)

# アニメーション開始前のフレームを描画
for i in range(start_frames):
    artists.append([im_x, text_x, im_y, text_y, im_base, text_base])

for i in range(max_iter):
    y2 = None
    if i == max_iter - 1:
        y2 = taylor(x, 100)
    else:
        y2 = taylor(x, i + 1)

    y2_diff = y2 - y2_old

    if i == max_iter - 1:
        text = text_taylor(100, 6)
    else:
        text = text_taylor(i + 1, 6)
    text_approx = ax.text(xlim[0], ylim[1] - 6, text, color="red", size=18)

    for j in range(animation_frames):

        # 近似曲線を描画
        rate = (j + 1) / animation_frames
        im_approx, = ax.plot(x,y2_old + y2_diff * rate, color="red")
        # アニメーションするフレームを作成
        artists.append([im_x, text_x, im_y, text_y, im_base, text_base, im_approx, text_approx])

    for _ in range(interval_frames):
        # アニメーション間のフレームを作成
        artists.append([im_x, text_x, im_y, text_y, im_base, text_base, im_approx, text_approx])

    y2_old = y2

# 各軸のラベル
ax.set_xlabel(r"$x$", fontsize=15)
ax.set_ylabel(r"$y$", fontsize=15)

# グラフの範囲を設定
ax.set_xlim(xlim)
ax.set_ylim(ylim)

ax.axis("off")

# ArtistAnimationにfigオブジェクトとimsを代入してアニメーションを作成
anim = animation.ArtistAnimation(fig, artists, interval=fps)

# Google Colaboratoryの場合必要
rc('animation', html='jshtml')
plt.close()

# 保存
anim.save('/content/drive/MyDrive/Python/アニメーション/テイラー展開y=e^x.mp4')